Trading Systems Part 1
This series shows you how to build a trading system. Within a system there is an almost limitless variety of buy and sell signals we could use, but here I purposely avoid advocating any particular method. That's because for many traders it's the system that is missing, not the ability to recognize a valid signal.
By learning how to build your own system you will have a trading method unique enough that you will be able to enter profitable positions hopefully before any advantage is arbitraged away by others. When enough traders play the same system, your entries, stops and targets would be discovered. Bigger players may find it profitable to bet against you, knowing that triggering your stops would allow them to enter in the same direction as you at a better price. By trading against you, the bigger players can reduce the profitability of your system and may even cause it to fail.
For that reason, I do not advocate you using any simple system outlined here. That's also true of just about any publically known system. It helps that there are so many systems out there, but what really helps is that so many beginning traders don't use systems at all. Instead, they make regular 'donations' to those who do, until their accounts are empty.
What I present below is just for learning purposes. It should be easy to adapt this material to your particular trading style and favorite indicators, and I show you how.
A system is simply a sequence of trades, all based on the same or similar signals. It is designed by carefully evaluating the historic data and the longer term charts. Any one trade might fail leaving you with a loss however a system covers multiple trades and the designer of a system looks for an approach where wins consistently beat losses.
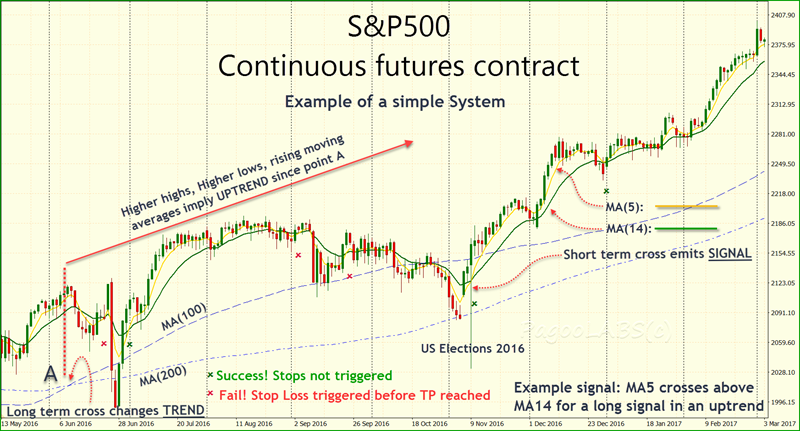
Above is an example of a system, although it makes little sense at this point. Nonetheless, you can see that we have six setups on this chart where we could place an open trade based on the crossing of two moving averages (MAs). They are marked by little crosses below where the MA cross occurred, green for success and red for failure. I will explain this in detail later on but for now it just means that whenever the five period MA, MA(5), crosses above the MA(14) we will open a long position. There is nothing significant in these MA periods, they are just to illustrate a simple system. There is also a pair of longer term MAs, the MA(100) and MA(200), which are only shown to emphasize the trend since point A.
The point here is that our first setup failed, as did the 3rd and 4th. However, three of the six trades here were successful. If the TP were twice the risk then this simplistic system would generate three times the risk in wins (2 x 3 wins - 1 x 3 losses = 3), and therefore 6% of our risk funds (2% x 3). Of course, I have to explain why we should be long and not short after point A, why I chose twice the risk for the TP, what's this crossing MA all about and what happened to the right of the chart. I hope this series on systems will answer all these questions and more.
In many of the examples I deliberately use a simple MA cross to determine when the trend starts and sometimes even the triggers that prompt us into a trade. Although simple, if we can make a system work well with MAs then imagine what you can do with all your favorite indicators. Also, MA crosses are easy to explain and draw, so just what I need.
Don't expect a system to be anything complicated. A system is consistent, and the easier to understand the better. A consistent system applies the rules in the same way on every trade setup. By being consistent, a system becomes testable. If we subtly change the conditions whenever we feel the normal human emotions of fear or greed, the system could fail but we won't know why.
If you have not used a system before it brings a major improvement for very little extra work.
Before we can discuss a trading system, I have some ground to cover on a few very important concepts. I have already posted a series on setups but we also need to discuss trends and signals. These two key topics will make up parts 1 to 4 of this series.
While I have tried to keep this presentation simple, I imagine most readers would have already thought about many of these issues. Perhaps you have been trading a while but have become frustrated how often you are stopped out of trades that afterward move in your anticipated direction. For this reason, much of the jargon of trading is not covered here, or when it is covered, perhaps I pass over it too quickly. If you hover over underlined text, a brief explanation will pop up on many uncommon terms. Please alert us via a post in the comments section whenever something is unclear.
As you design your own systems I hope you will discuss your experiences on our forums. The best way to learn is to put your own ideas out there for discussion, get help and hopefully have your system improved by other members. Feel free to post replies to existing stories and, when you have enough points earned from posts, you will be able to post your own stories. Eventually you will be able to start and moderate your own forums when you have accumulated enough reputation.
If you have not done so already, I recommend that you first read through the series on "The Basic Setup". This current series on Systems relies heavily on material discussed there on the Open Price (OP), Stop Loss (SL), Target Price (TP) and Contracts Opened (CO).
From "The Basic Setup" we will assume in what follows a risk capital of $100,000 and a risk per trade of $2000. Because your risk capital is almost certainly different, just divide or multiply the per trade amounts depending on your available funds.
After reading this series on systems, you should know:
- how to spot a trend
- the difference between a setup, a signal and a system
- how to use your preferred signaling method in a full system
- how to measure the number of wins and losses and
- how to test whether your system has worked in the past.
Everything I have to say here on trading applies equally whether short or long. However the descriptions become tedious to read when every sentence has to be qualified with something like "or sell if short". For this reason, in most of what follows unless otherwise stated, I will assume an uptrend (or bull market) and long positions. This is just for convenience and does not imply that being long is preferable to being short.
The Trend
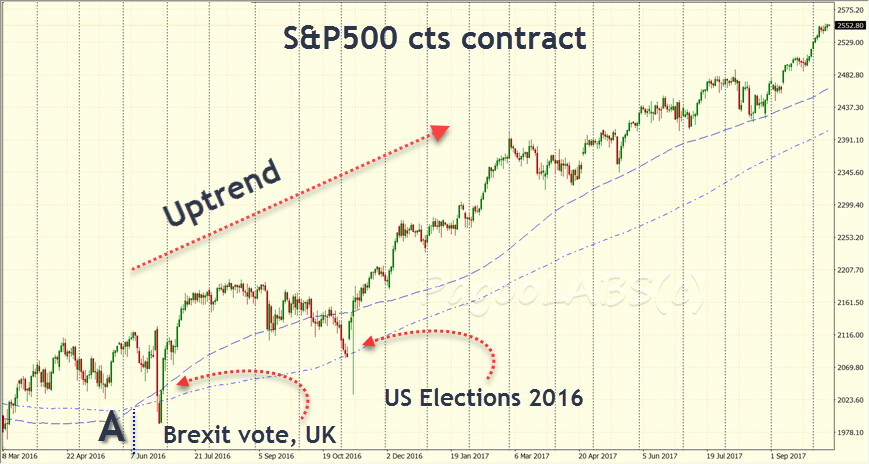
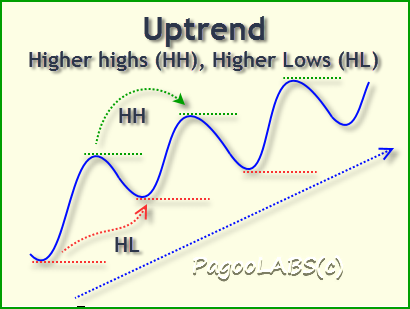
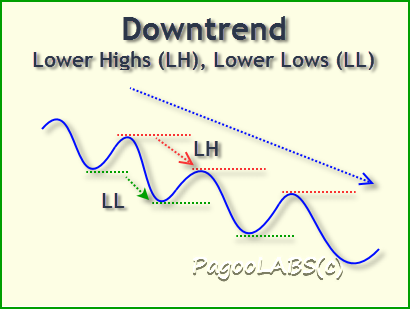
Markets spend most of their time consolidating sideways. You could build a system around this fact alone but it's not what we will do here. Instead we will focus on trending markets because those are more likely to result in a winning trade. Also the market is more likely to move to a TP that is a greater distance from the open price than the SL.
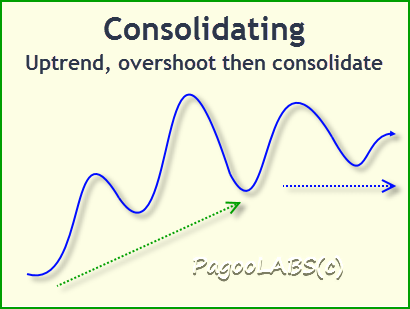 When favorable information first hits the market, prices start to rise to some higher level. The prices then either consolidate, or fall back if the rise was too high or too fast. But if the asset such as gold, oil, the S&P or some currency is now worth more to the market, why doesn't the market immediately jump to that new higher level? After all, who would sell below that level and who would not be buying? Both of those factors should push the price up to the new level immediately.
Sometimes markets do adjust quickly and when that happens politicians and traders on the losing side howl that something has gone terribly wrong. But in general prices adjust slowly for several reasons:
- it's rarely clear at the time prices begin to move where that higher or lower stable price range lies
- funds have to be moved out of other markets first and perhaps now is not the best time
- the price rising is itself confirmation to other traders that the news is in fact bullish, so the initial price rise accelerates, sometimes overshooting
- some traders may think that the initial price rise was sufficient for this piece of news and either take profits or short it.
There are many different players in every market each with their own competing perspectives. Some players are central banks with a policy to push, others are major corporations hedging against a product they have committed to deliver. Still other players may have misinterpreted the significance of the news.
All of these factors combine to slow down the movement in market prices as they adjust from the previous stable trading range to the new higher one. During that period of adjustment we have a trend.
Moving Averages
Moving averages (MA) are useful to help you visualize the trend. They work well in computerized systems that need a numeric computation in the absence of being able to visualize a chart.
A moving average simply takes the current price in each period and averages it with the prices from a given number of previous periods. That number is called its period and represents an historic average. The MA cannot take into account the future because that is not known in the current period. As each new period trades, its price is added into the calculation of the average while the oldest price is dropped.
In that sense, the average moves along from oldest to newer prices. Exponential moving averages are similar but give greater weight to more recent prices and typically have a lower weighted memory of all previous prices.
Although not necessary in a trading system, it is common for charts to have at least two MAs, a longer term one and another that's shorter and therefore faster reacting. Even price action traders who have no other indicators on their charts, often have a couple of MAs.
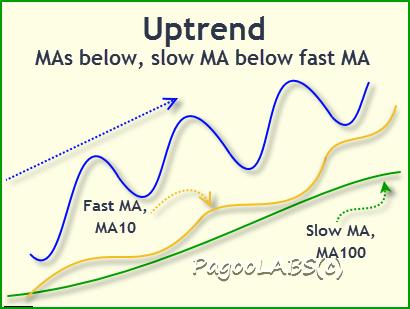
An MA averages out today's prices with prices from the past. In a bull market, the most current price will tend to be higher than in the recent past so the MA should be below where prices are trading. An MA that averages back over a longer period will tend to be further below and slower to react to changes in current prices because it is averaging over a larger number of earlier, lower prices. The latest, higher price has less effect on a longer average.
Therefore we can refer to the longer one as the slow MA and the shorter as the fast MA.
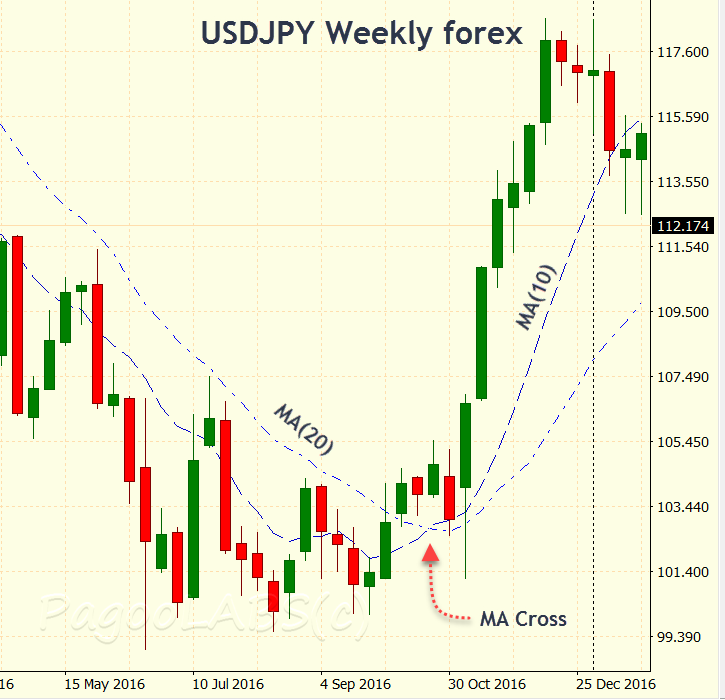 If a market is moving up smoothly, the shorter MA will lie above the longer. In a bear market the pattern is reversed with the MAs lying above the prices and the longer above the shorter. If the trend changes direction from bear to bull or recovers from a severe retracement (a correction), the faster MA will move up first and may cross the slower MA.
This is shown above on the chart for USDJPY. Whether they cross or not will depend on the period used for both MAs. For some traders, this triggers a signal to enter the market. There are many ways to trigger the opening of a market position, and crossing MAs is just one.
Summary
The trend is an essential component of a trading system because trading against the trend is more hazardous and trades aligned with the trend have a greater probability of success.
Moving averages are one tool that can help you identify trends and MA crosses help recognize trend reversals.
In the next story I will discuss several aspects of trend following such as timeframes and fundamentals.
Disclaimers
Although the PagooLABS site is educational and does not advocate any position in a futures or forex contract, it is important to present the following disclaimers as additional information. Trading these markets can be risky and you must be aware of the following:
U.S. Government Required Disclaimer Commodity Futures Trading Commission Futures and Options trading has large potential rewards, but also large potential risk. You must be aware of the risks and be willing to accept them in order to invest in the futures and options markets. Don't trade with money you can't afford to lose. This is neither a solicitation nor an offer to Buy/Sell futures or options. No representation is being made that any account will or is likely to achieve profits or losses similar to those discussed on this web site. The past performance of any trading system or methodology is not necessarily indicative of future results.
CFTC RULE 4.41 "These results are based on simulated or hypothetical performance results that have certain inherent limitations. Unlike the results shown in an actual performance record, these results do not represent actual trading. Also, because these trades have not actually been executed, these results may have under-or over-compensated for the impact, if any, of certain market factors, such as lack of liquidity. Simulated or hypothetical trading programs in general are also subject to the fact that they are designed with the benefit of hindsight. No representation is being made that any account will or is likely to achieve profits or losses similar to these being shown."
Copyright (C) PagooLABS 2017. All Rights Reserved.