Trading Systems Part 4 - Examples of Signals
The previous story described the class of triggers we call signals. In this story we will explore some simple examples of signals. Most of these you will be familiar with and they help to clarify the terms we use in the next story on systems.
As examples, we will discuss the following types of signals:
- MA cross
- Pin bars
- Engulfing patterns
- Heikin Ashi reversals.
Moving Average Cross signals
An MA cross signal occurs of course when two MAs cross. One MA has a longer periodicity than the other meaning that it will be slower to react to the latest prices while the MA with the shorter time period will react faster. If the previous trend had been a bear market then prices would generally be below the two MAs with the faster MA closer to the real market prices than the slow MA.

In a bull market, the opposite occurs with the slow MA below the faster, and both below the actual rising prices. The two charts of EURJPY show different phases of a cycle, with the first above showing a downtrend with the MAs lying above and to the right, and the following chart showing an uptrend with MAs underneath.
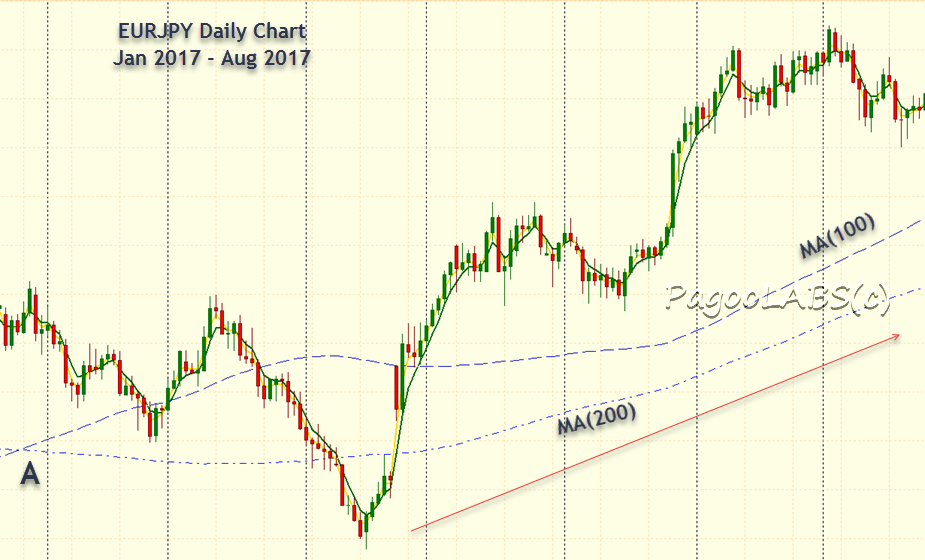
For the slow MA to be above the faster MA in a bear market but below in a bull market they must have crossed over at some point when the trend reversed. This is point A in the charts. This crossover point is frequently used as either a trend starting point or even as an entry signal for actual trading.
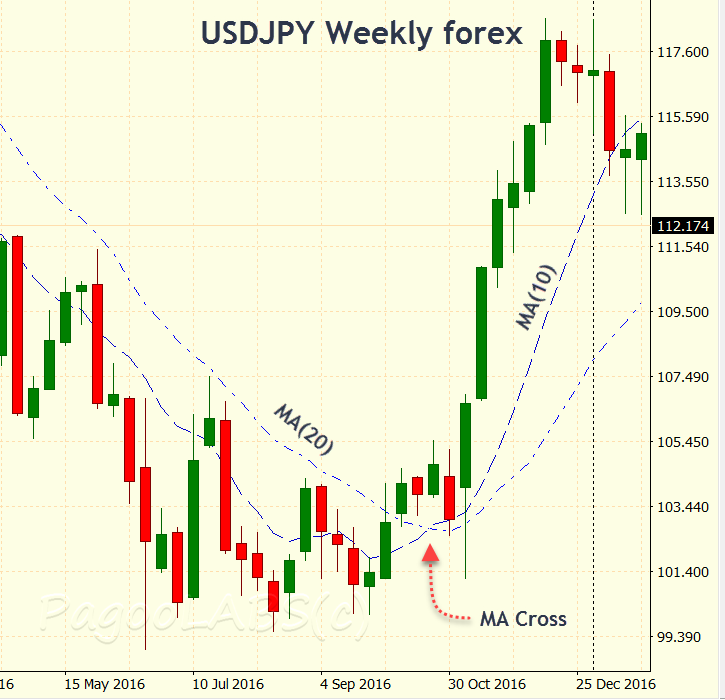
We could use a second set of MAs with even shorter periods, such as MA20 and MA8, as our signal while reserving the longer 100 period MA as an indicator of trend. While admittedly simple, such a trading system could in fact work, depending on how you tested and implemented it. If there is an advantage to using a more complicated system, you should find that out in the testing.
The setup itself is made complicated by the long period of time that evolves while a cross is taking place and the fact that because we are dealing with averages, the low probably does not occur in the same period as the cross. Instead find the lowest price of all the bars leading up to the cross starting from the last downtrend. During the downtrend, prices were higher. At some point they must have flattened out before turning up to create the cross. Sometime in that period a lowest price must have been set. Use that low for the SL. Refer to the accompanying chart of the S&P futures.
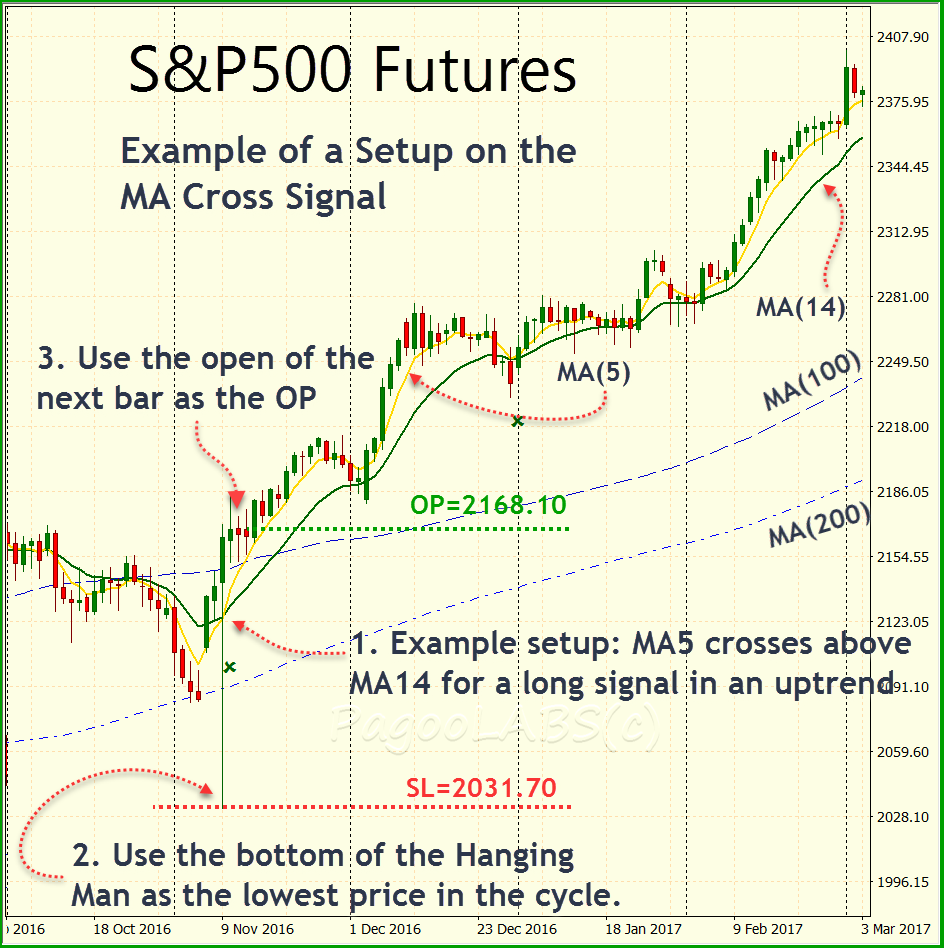
Even if you witness a cross forming during the period, it may or may not actually appear on the charts depending on the closing price of the bar that day. You can never be sure the cross will complete until the close of trading. The open price should be the open of the very first bar following the cross although you're free to enact some intricate open policy that involves a confirmation pattern. That policy emerges later from your testing.
With the SL and OP set you can easily calculate the number of contracts to open (CO). The TP would usually be based on some multiple of the risk (OP-SL) and I will discuss that important topic in the story on testing systems. With the OP, SL, TP and CO we have all the elements required for the setup based on a particular signal.
To summarize the MA cross signal:
- In an uptrend, when the faster MA crosses from below the slower MA to above, open a long position.
- In a downtrend, when the faster MA crosses from above the slower MA to below, open a short position.
But MA crosses are just one class of signals out of many. Let's look at a few more.
Pin Bar Signals
Pin bars belong to a set of simple candlestick patterns, such as doji, hanging man or shooting star. These are sometimes called pin bars when they exhibit certain extra characteristics such as position, shape and size that dominate surrounding bars. There are many other candlestick patterns and we plan to run a future story on some of these and how to use them in a system.
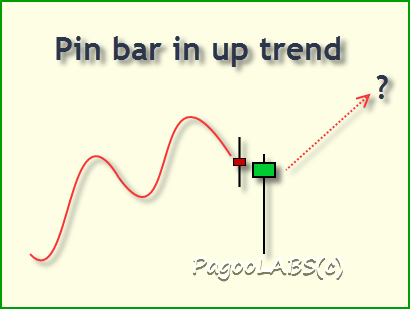 A pin bar is a candlestick with a small body at one end and a much longer tail. The key idea is that a particular area has been tested by the long tail and rejected. The market probed down into the support area, triggered the stops and instead of continuing in that direction, bounced right back. The open trades that did not trigger are now considered to belong to stronger hands: traders who are less likely to be stopped out next time.
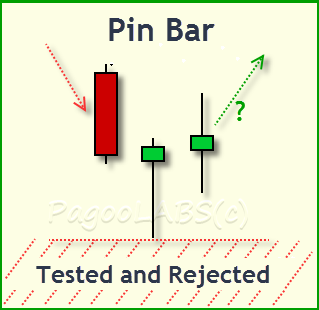 By shape alone, a pin bar is like a traditional hanging man or shooting star candlestick, although most practitioners only accept a subset of such candles as true pin bars. A true pin bar must usually dominate the surrounding pattern and either indicate a resumption of the trend after a retracement or be at the bottom or top of the range in a sideways market. You should strongly avoid accepting every hanging man or shooting star as a pin bar signal. Critically examine the charts to see how often this pattern fails to work as a signal when it is against the trend.
The setup is straightforward - the SL should be just beyond the tail of the bar, and the OP could be the open of the next bar. Or you could set a stop-limit order to trigger you into the trade when the market price moves above the top of the pin bar head (for a long trade).
With the SL and OP set you can easily calculate the number of contracts to open (CO). As with the MA cross, the TP would usually be based on some multiple of the risk.
Using only a pin bar is not a complete system because if the setup is stopped out, it is rarely followed by another pin bar to signal re-entry. However it can be combined with other entry signals such as the engulfing or outside bar pattern to provide a more complete system, and we turn to that now.
Engulfing pattern signals
An engulfing pattern or outside bar is a two bar pattern where the second bar reverses direction and has both a higher high and a lower low than the first. In other words, the second bar encloses or engulfs the first.
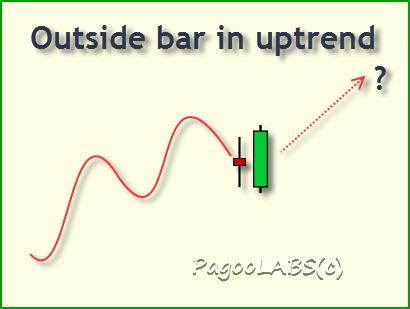
If you think about it, this is similar to a pin bar except it plays out over two periods instead of one. On the first day (or period) the market continued its retracement against the trend. On the second day the market opened lower in a bearish sentiment and attempted to go even lower before surrendering to the upward trend in a wave of buying that sent prices higher than the open of the previous day.
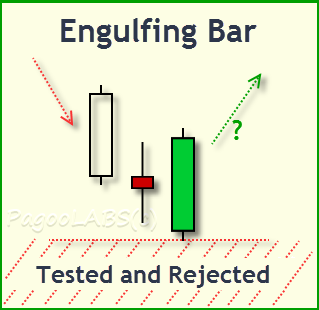 As with the pin bar, there is the strong sense that the area below has been tested and rejected. But testing and rejecting really only makes sense when the market is probing against the real underlying trend. When prices are moving with the trend there are multiple examples of engulfing patterns that never lead to any price reversals.
The setup is similar to the case of the pin bar - the SL should be just beyond the tail of the larger outside bar, and the OP could be the open of the next bar or you could set a stop-limit order to trigger you into the trade when the market price moves above the top of the outside bar (for a long trade). The TP and CO are as discussed earlier for the other signals.
As with the pin bar, it needs to be combined with several other signals to be a complete system. Together with the pin bar you might be able to catch at least one of the entry points in a trend but whether it's enough to offset losses would depend on what your historical tests will show.
To make the engulfing pattern and pin bar more complete, you could also add the Piercing Line pattern (or Dark Cloud Cover) as well as a number of two bar reversals that don't quite qualify as engulfing patterns.
In 24 hour forex markets, gaps at the open are not possible unless they happened in the final minutes of trading. For this reason, outside bars are less prevalent than two bar reversals where both bars have a common low but the second has a higher high. You might like to use these in addition to engulfing patterns if you are trading in forex markets.
Candlestick patterns are a huge field and there is much to explore. Fortunately there are many sites on the web that cover all these patterns.
Heikin Ashi Candlesticks
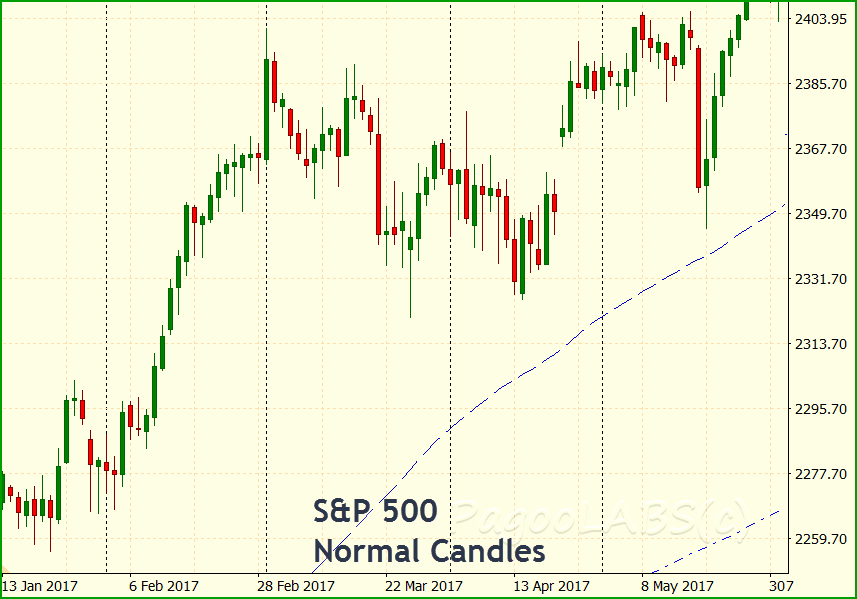
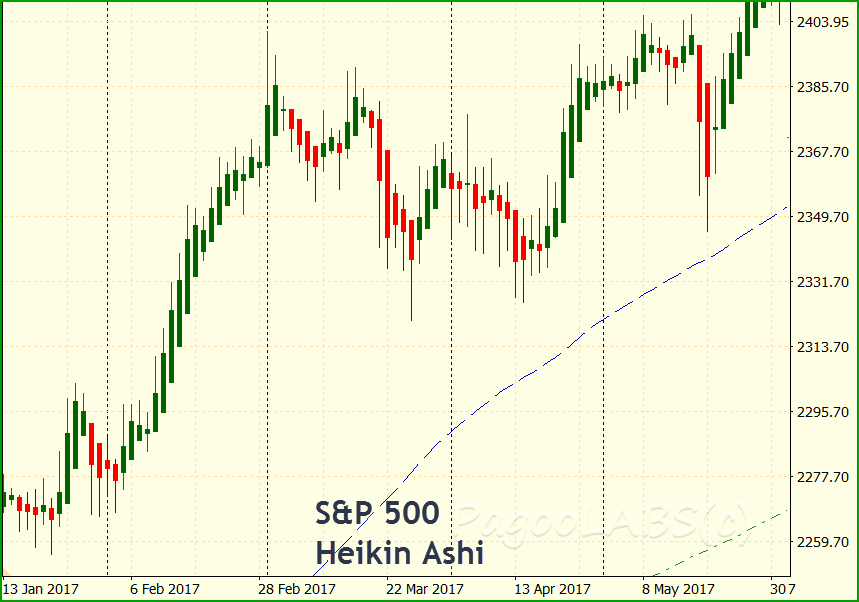
Heikin-Ashi (HA) is a different candlestick design that smooths out the shortest term fluctuations in each bar. Because HA bars are a different shape than the standard candlesticks, the technique is not very popular with traders. However there are solutions to most of these problems. HA is presented here as an example of an uncommon technique. Below, side by side are the same two sections of the chart of the S&P futures contract. The chart with the normal candles is to the left and on the right is the same chart using Heikin Ashi candles.
Where t represents the current period, and t-1 the previous:
    haClose = (Open[t] + High[t] + Low[t] + Close[t]) / 4
    haOpen = (haOpen[t-1] + haClose[t-1]) / 2;
    haHigh = maximum of High[t] and haOpen;
    haLow = minimum of Low[t] and haOpen;
So the close is just the average of the current periods values but the others are all averages in some way of the earlier period, unless the current high is higher or the current low is lower than the average. It should come as little suprise that the HA reversals track an exponential MA cross of very short duration. 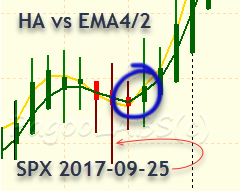 The short period, or fast MA, uses EMA(2) with HLCC/4 as the value used in each period (if this is confusing then just use the normal close value).
Where they cross is often the same time period where HA changes direction, so we can use the MA cross as a proxy for HA when it's not available. For the long period, or slow MA, use EMA(4). Remember the bars must close before you can know whether the MA crossed in that period or not. It's much easier to visualize these reversals with HA so you would only use MAs if HA is not available in your charting software.
In fact, many of these signals are not independent of one another because they are based on the same four market numbers contained in OHLC. There are only just so many ways you can slice and dice four numbers so you will often end up with the same result from otherwise different indicators.
Here is an example of the EURJPY downtrend chart shown earlier in the section on MA crosses, but this time using Heikin Ashi bars. 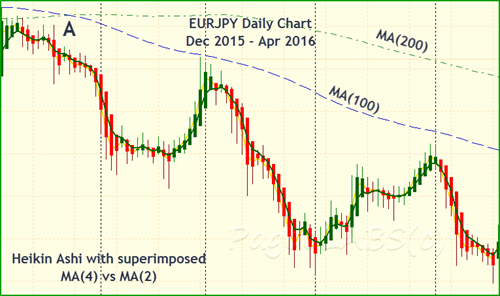 In these charts, HA is displayed in red whenever the haClose<haOpen, and in green otherwise. A great advantage over normal candlesticks is HA highlights the runs in one particular direction, smoothing out the minor fluctuations that distract you from the bigger picture.
To be sure, HA candlesticks cannot replace the normal charts, but they are a great addition when you flick quickly between both. If your software allows multiple open charts, and most do, just set up the normal chart in one window and the Heikin Ashi chart for the same instrument in another.
HA signals
One signal that is readily apparent is to open whenever a bar changes from red to green if the trend is up. You must not already have an open position and you will need to wait until the first green bar is complete at the end of the period. Because the bar has changed color, there must have been a low set during the change, either on the new green bar or one of the immediately preceding red bars. Just below that is where you place your stop loss.
The setup then is similar to the case of the MA cross. With the SL determined, the OP should be the open of the first bar after the green reversal bar (red in a downtrend). The TP and CO are as discussed earlier for the other signals. See The Basic Setup if you are unclear on any aspect of the setup tool.
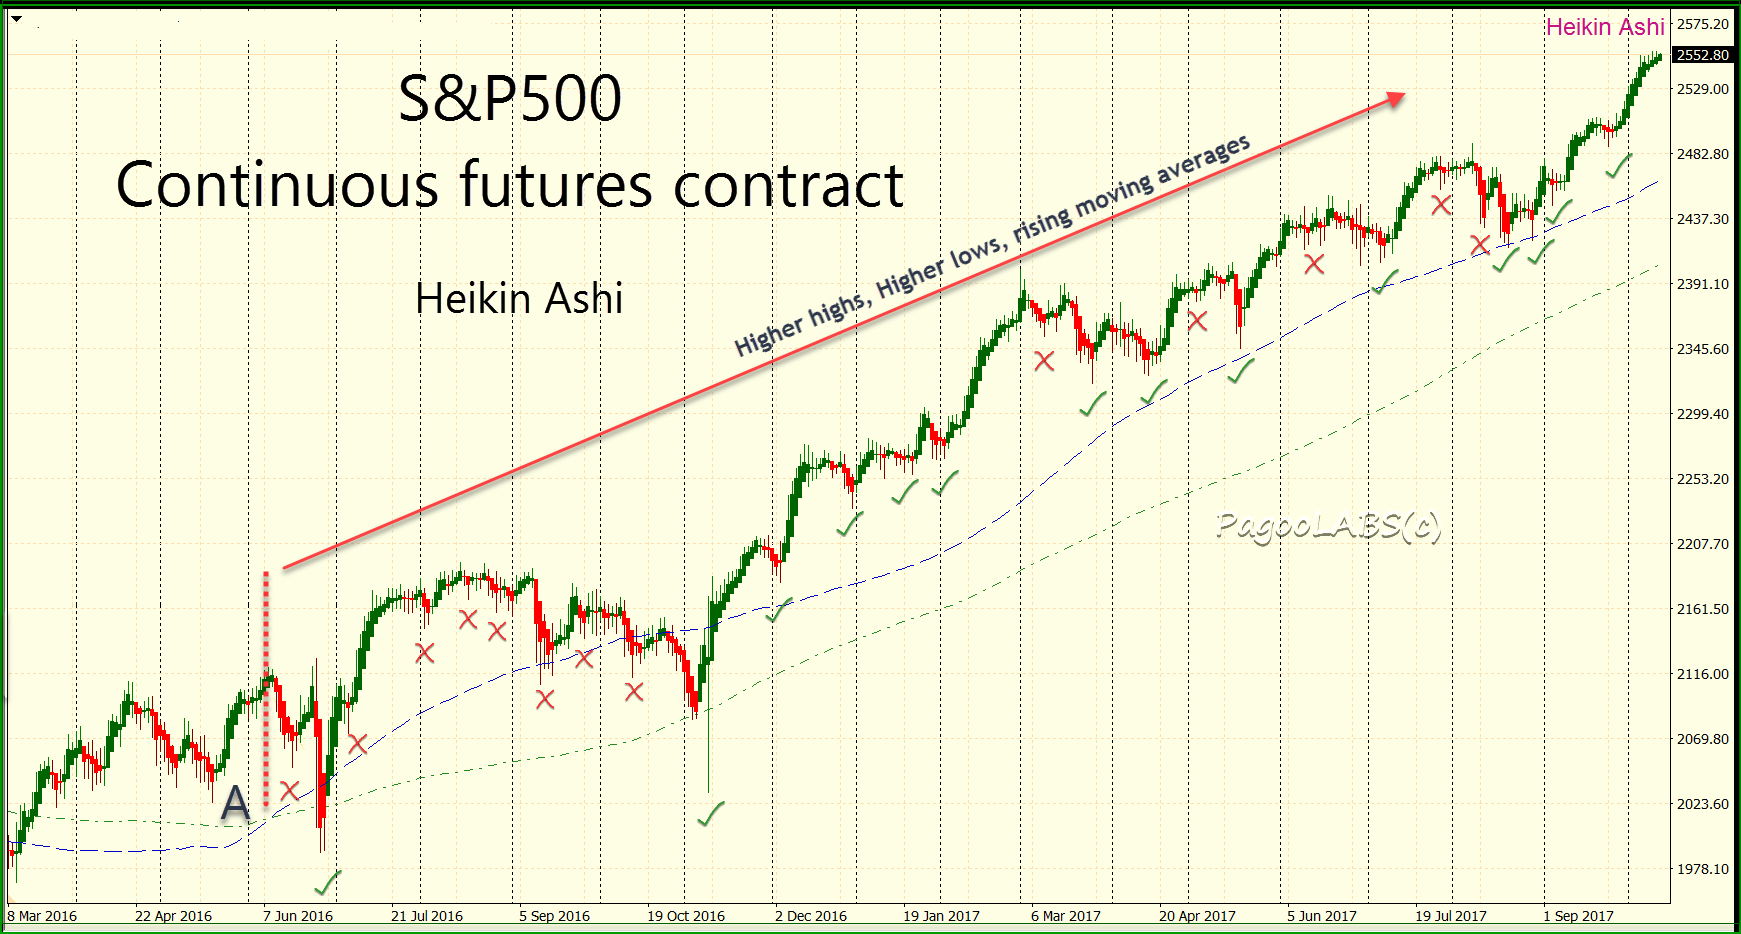
Above, in the Heikin Ashi chart of the S&P500 continuous futures contract, most of the HA reversals have been marked with a green check if they have not yet been stopped out, or a red cross if subsequent prices triggered the SL.
Even in an uptrend it's possible to see that about half the reversals were successful and the other half failed. That's because the unsuccessful signals occur in areas of consolidation and involved much whipsawing causing many minor reversals. The successful signals on the other hand resulted in resumption of the trend and continued for some time before the next HA reversal down.
If you open a signal that eventually fails you will open the next signal, which should come after the series of bars that stopped out your trade. If that fails you will open the next, and so on. Eventually, unless the trend has changed, you will be in a position that has the lowest SL of all those earlier failed trades.
You can see this on the chart above in the troublesome area after point A. The first setup fails, triggered by the concerns over the UK Brexit vote. When the market resumes in the direction of the trend, a new HA signal is triggered, this time with a lower SL than the first setup. None of the bad HA setups that follow should impact the open position because its stop never gets triggered and one of the rules is to not open a second position.
However if for some reason you did not enter on the first signal, the next occurs about six days later. It eventually fails, stopped out by the US 2016 election result. Before then however there are multiple signals to enter, all of which fail for the same reason, but none of which affect you because you already have an open position. The point is that many of the failed signals on a chart are irrelevant, you will be in the first one until that fails, if it does. If it wins it will of course need a TP to compensate for the losses.
The HA signal is complete in the sense that the trend cannot resume without you. It is not possible for the market to trade higher after a period of retracement without first signaling an HA reversal.
What could go wrong is that the reversal bar could be very large and untradable, like the spike we talked about above for pin bars. In that case you will have to wait for a more reasonable sized correction. Large spikes usually, but not always, provide these later opportunities. In the meantime however, you could miss out on a substantial rally in line with the trend.
Aside from the huge reversal spikes, the only part of the trend that is not covered are the bars after the TP has been hit and before the next HA signal. If the next signal is higher than the TP, which can happen, then the trader will miss out on a portion of the trend.
The disadvantage of the HA is that it displays candlestick bars that are slightly different to the real bars - it is after all an averaging system. To correct this, use your software to show both charts, the normal one and the HA, side by side. Or better still, place one chart on top of the other and then flick between them so that you can see the signals and the original chart. In this series, whenever I can, I will try to place them side by side with the HA on the right. Also, the normal chart has the EMA4 (green) and EMA2 (gold) moving averages so that you can compare the signals with the HA chart.
This section has not done justice to Heikin Ashi which has its own set of candlestick patterns differing from the traditional ones. Candlestick tails (shadows) or their absence take on new meaning. If you are interested, there are many books and sites on the web that discuss this technique further.
Custom Signals
These examples above illustrate how to create a setup around any custom signal. All that is required is a clear, unambiguous trigger to open a position starting at a particular time period with some condition specifying the open price. To open the position you use the setup tools from our earlier series on "The Basic Setup". Looking around the area the signal occurs, you should be able to identify the most appropriate SL level. The setup tools describe the number of contracts and your own simulation described in a later story determine the TP.
Summary
Here we discussed what qualifies as a signal and showed several different signals based on MAs, candlestick patterns and Heikin Ashi charts.
Note, these are all simple signaling systems: there is nothing complex about a pin bar or crossing moving average. Taken by themselves they could lose more than they would win. However when combined into a system they become powerful trading tools.
In other stories and posts I may use different signals just to show how widely the system method can be applied. While it does not depend on any one signal strategy, every system needs at least one signal strategy in order to trigger opening a long or short position.
The problem with signals is that sometimes they fail and the setup is stopped out. By itself, all we can say is the signal was successful or unsuccessful. However if losses are accumulating in the account then you are faced with the very real prospect of being wiped out. We need the bigger picture to see if all the positions we have opened as a result of signals are winning or likely to win.
Now we turn to building our first system. With all the building blocks in place - trend, setup and signal - it is just a matter of assembling them in the right order into a system.
Copyright (C) PagooLABS 2017. All Rights Reserved.